
Tuesday, January 20, 2009
All Future Forex Training...
Will be posted on my site blog I just set up. Learn Forex trading over there now >

Saturday, January 17, 2009
How To Trade Using Fibonacci To Follow Price Action
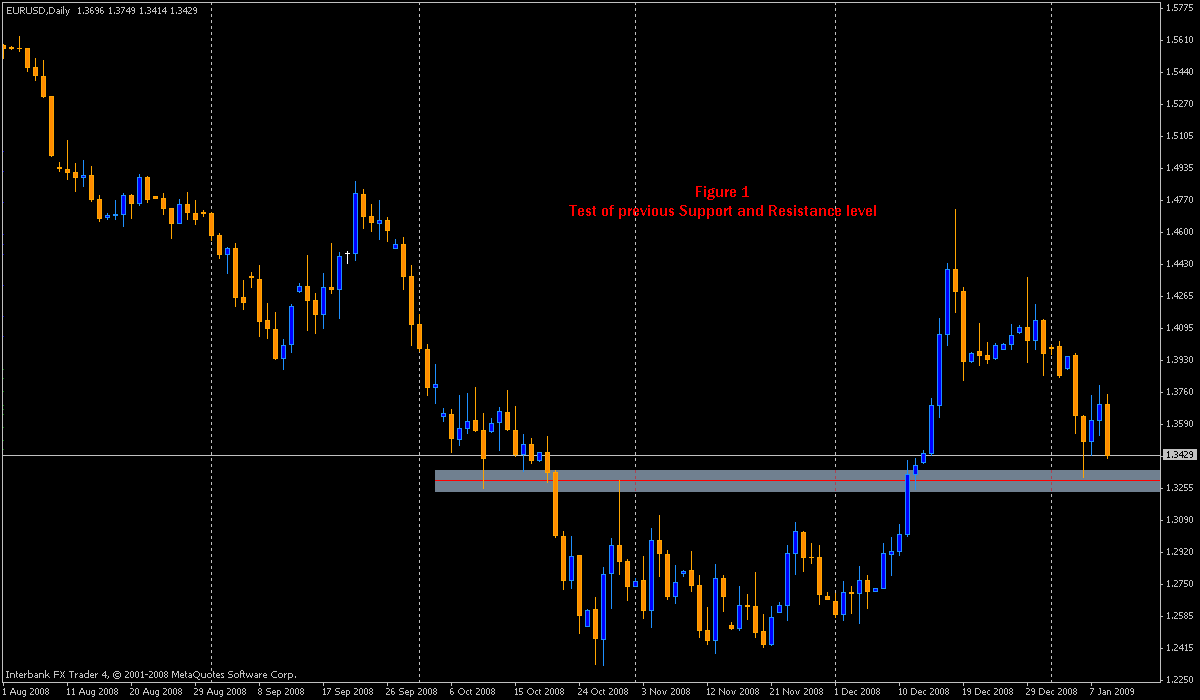
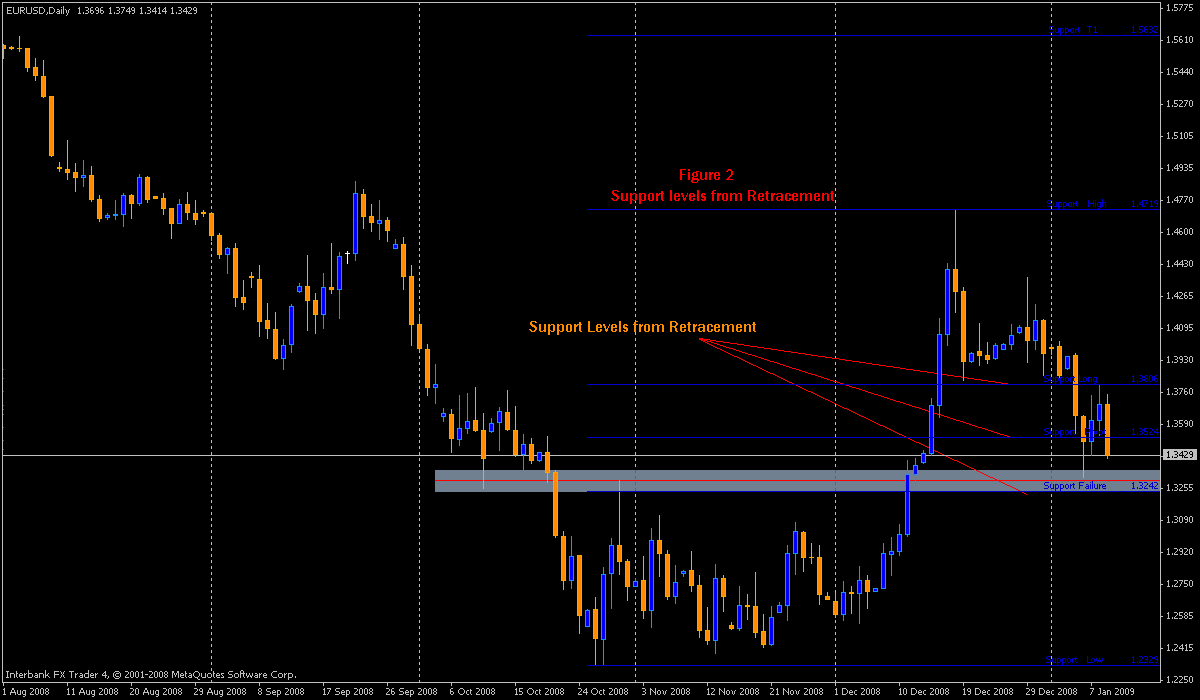
This week we'll look at using the Fibonacci retracement tool to gauge price movement and give some pointers on using the Fibonacci retracement tool. In this example we'll use the USD/Yen and start from the 4 hour perspective. (Figure 1) is the starting point where we watch the retracement. After making a high we see price begin to fall, find mild support and begin to move back up. As it moves back up we can use the fib tool to point out the resistance levels to price.

Figure 3

Figure 4
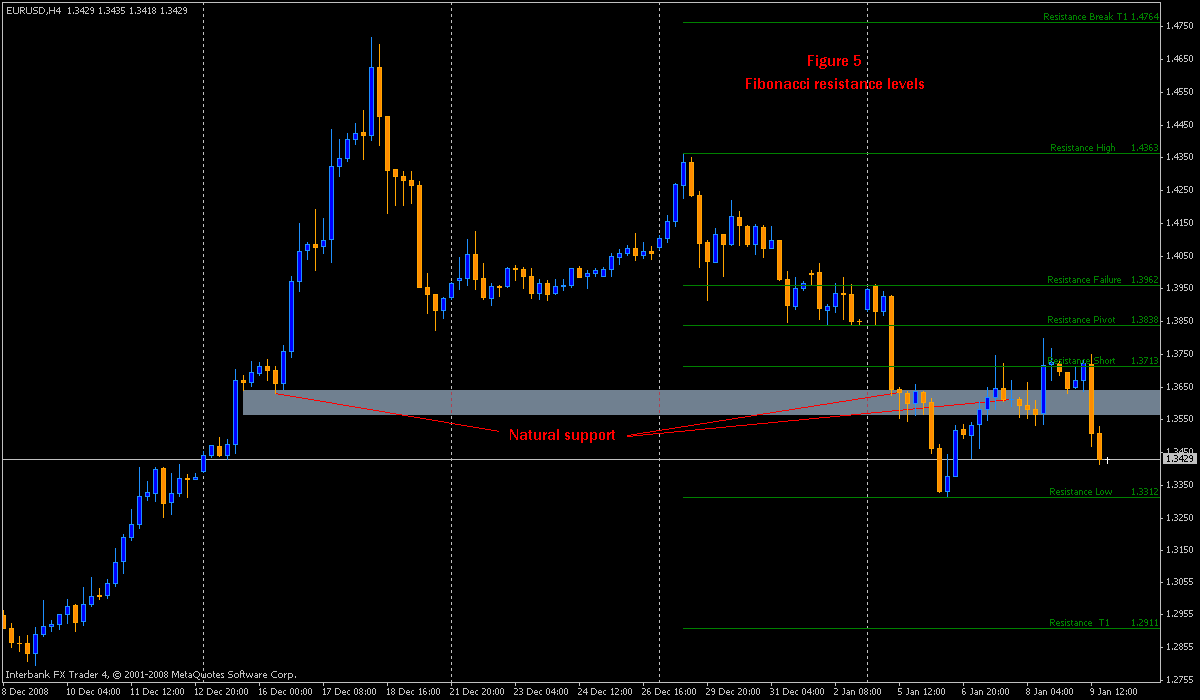
The next step is to gauge the next movement of price by simply measuring the current movement since a new low appears to be in the making and if this is a low point we want to know the new resistance levels to price; if we do see a bounce here. We move the low of the fib tool now to the expected new low just created at the previous target point. (Figure 5) shows the new placement of the Fibonacci retracement tool as we continue to follow price with our fib tool. The purpose of doing this is to establish the new resistance levels to price from the fib tools Inner levels (38.2, 50, and 61.8).

Figure 5

Figure 6

Figure 7
The process continues but there are 2 options here now. Since there was no previous retracement to the Inner levels before this second target range was met we can either leave the tool in place as it is and use the next levels of extensions. In (Figure 8) we show an example of this option.


Figure 1

Figure 2
Figure 3
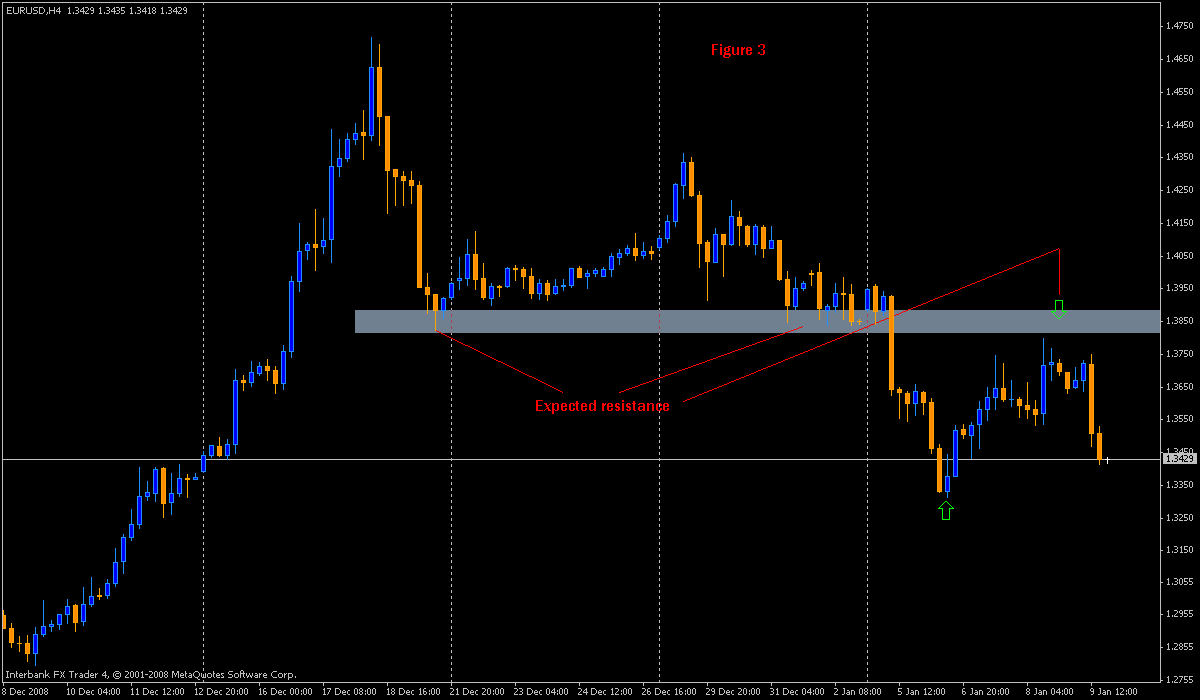
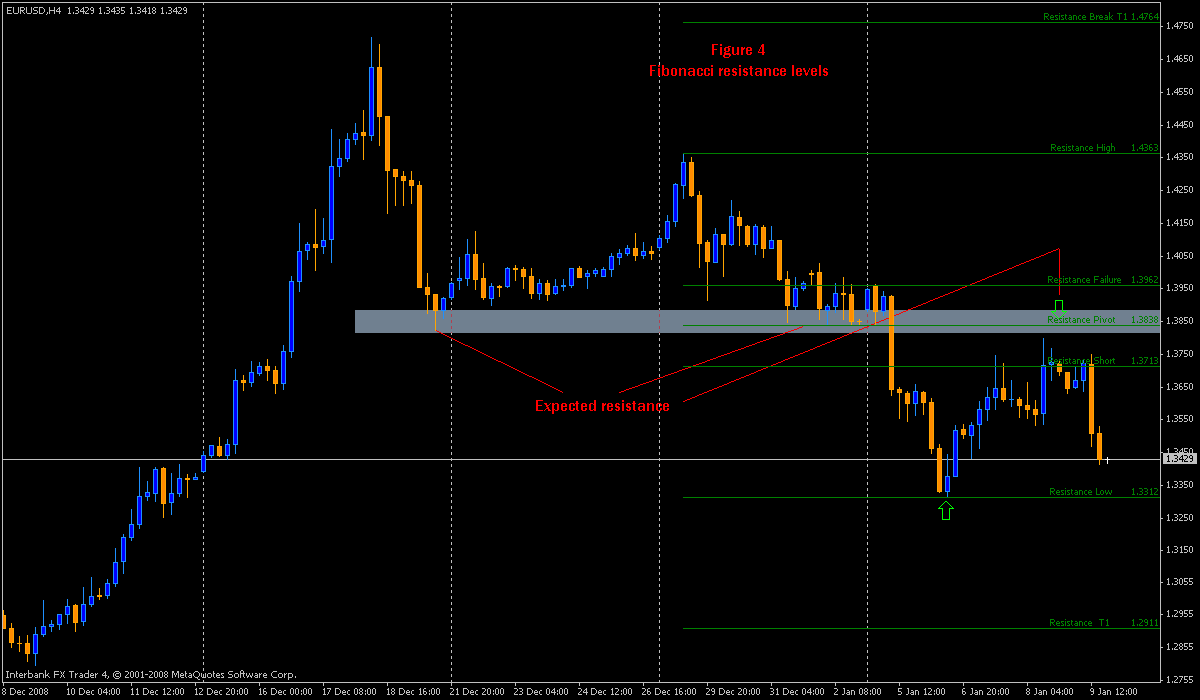
If we look closer now at the target points or the extension levels of the fib tool and the reaction of price one these price levels are reached we find that price stalls out at this point and some bullish action takes place. Once price reaches the target points we see that the candles are leaving wicks on the bottom of the candles indicating buying pressure and even profit taking from short positions. In (Figure 4) we look at this action.
Figure 4
The next step is to gauge the next movement of price by simply measuring the current movement since a new low appears to be in the making and if this is a low point we want to know the new resistance levels to price; if we do see a bounce here. We move the low of the fib tool now to the expected new low just created at the previous target point. (Figure 5) shows the new placement of the Fibonacci retracement tool as we continue to follow price with our fib tool. The purpose of doing this is to establish the new resistance levels to price from the fib tools Inner levels (38.2, 50, and 61.8).
In (Figure 5) we see something different than before, after reaching the previous target point's price attempts to retrace but fails as the selling pressure resumes and the low breaks before resistance levels are tested. This is an indication of trending strength. The less a pair retraces the stronger the trending momentum is.
Figure 5
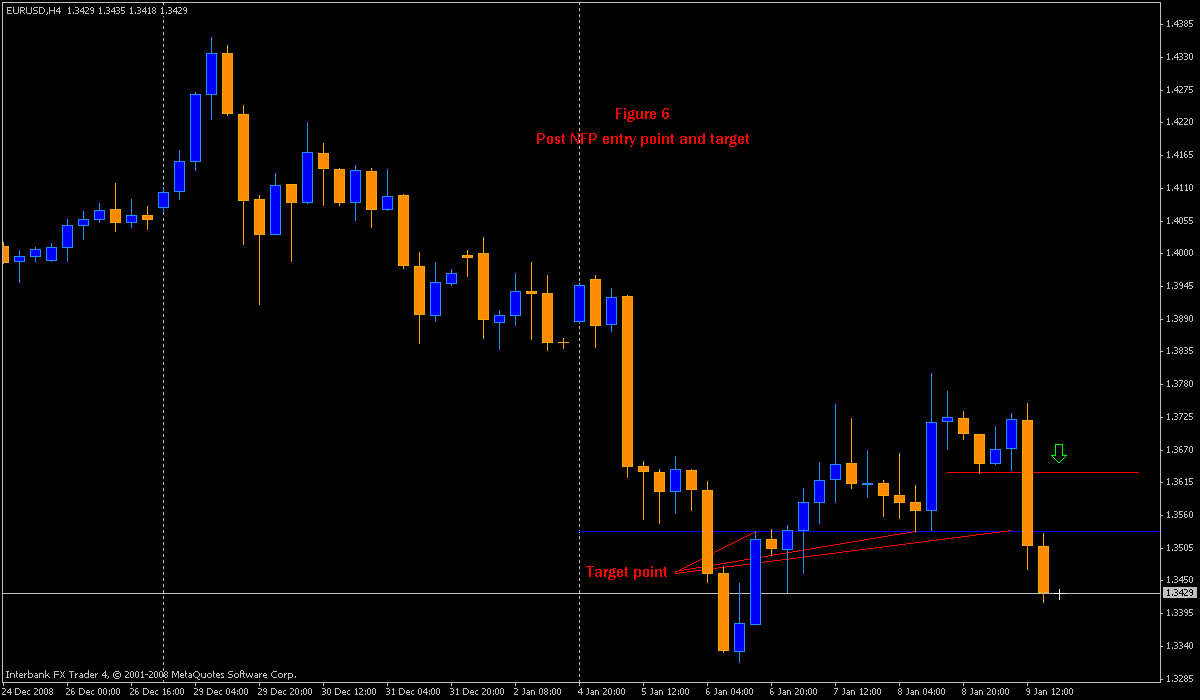
The process now repeats itself as we look for the next target points or levels for price by looking to the extensions once again, if price reaches these levels we'll examine the price action at that point. In (Figure 6) the new target range from the break of the low is identified.
Figure 6
Price reaches the new target range and we see a similar condition as before once the target range was met, we begin to see some bullish price action as the candles leave longer wicks on the bottom of the candles. In (Figure 7) we look closer at this action or reaction of price at the new target range. We see the buying pressure and profit taking.
Figure 7
The process continues but there are 2 options here now. Since there was no previous retracement to the Inner levels before this second target range was met we can either leave the tool in place as it is and use the next levels of extensions. In (Figure 8) we show an example of this option.

Figure 8

Figure 9
Now that this target range is met we see the market go into a ranging period where progress cannot be made in either direction. This will occur when the market needs more fundamentally to establish an imbalance in the current value; then the market will begin to move again.
The next step is simply repeating the process now and we can measure this entire movement down to give us the resistance points if a low can be established and we will have our targets on a retracement now. The targets on a retracement become the Inner levels of the Fibonacci retracement tool. (Figure 10) represents the target points for a retracement.On a retracement we look for the same price action signs and we can see in this case the retracement reaches the Inner levels of the fib tool and price is reacting to the resistance felt as it does reach the 38.2 level and we see the same price action signs as price is being rejected now from selling and profit taking at the Inner levels.
Figure 10
I hope you enjoyed this quick lesson in the use of Fibonacci and if you would like to learn more or would like to learn how to trade Forex by adapting to the market and following price, (rather than blindly with an indicator based method) visit us at Bobokus.com and become a Trade Kings Club member.Saturday, January 10, 2009
Jeff's Forex Market Notes - January 11th, 2009
Tuesday, January 6, 2009
Subscribe to:
Posts (Atom)


